USD/CAD Holds 200-Hour Moving Average as Tariff Rally Stalls
A 50% U.S. tariff threat on Canadian goods fueled a sharp USD/CAD spike, but the pair is now testing a critical technical floor.
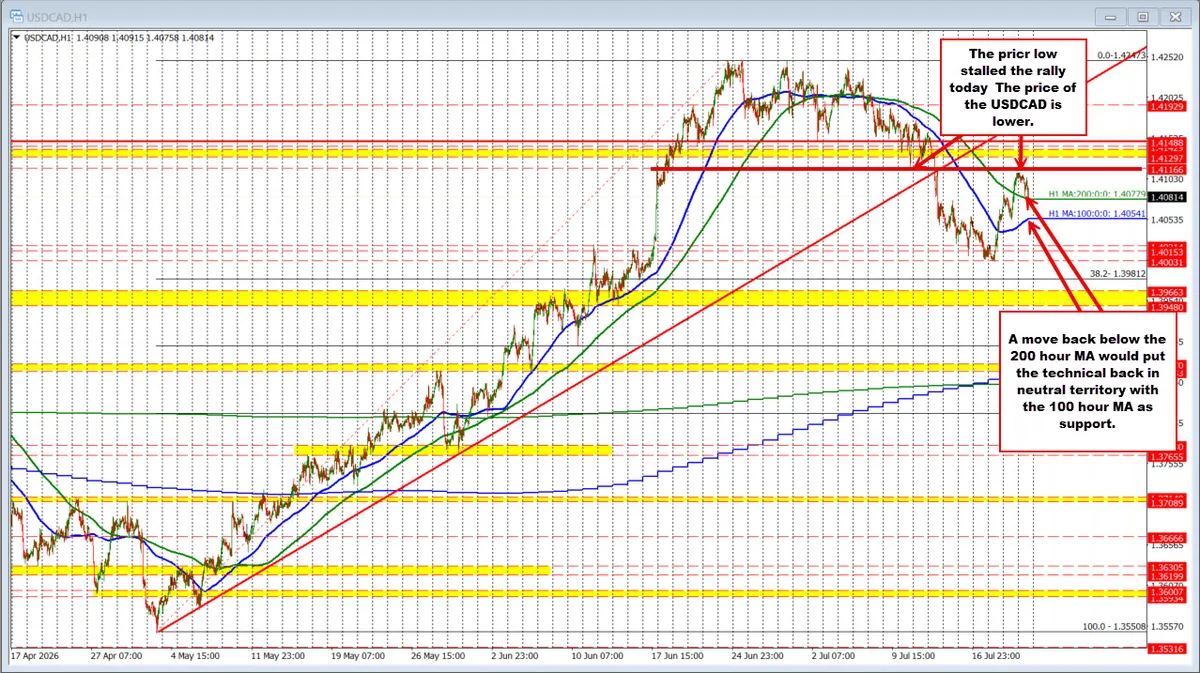
The U.S. dollar surged against its Canadian counterpart earlier this week after Washington announced 50% tariffs on select Canadian imports, reigniting trade-war anxiety and giving currency traders a reason to buy the greenback. That macro catalyst was enough to shift short-term momentum, pulling USD/CAD off its weekly lows and back into technically meaningful territory. The episode is a reminder of how quickly trade-policy headlines can override chart setups — and how quickly those gains can be questioned once the initial shock fades.
The technical milestone of the move was the pair reclaiming its 200-hour moving average on Wednesday for the first time since July 8, a level that had capped price action for nearly two weeks. Momentum extended toward resistance clustered near 1.4116 — a zone anchored by the July 10 swing low and July 14 swing high — but buyers fell just five pips short before stalling. That failure to punch through overhead supply set the stage for a pullback that has brought the pair almost exactly back to where the rally began: the 200-hour moving average, currently near 1.40779.
Read more Adobe Stock Jumps 5.6% But Trades Far Below Estimated Fair Value →
What makes the current moment analytically significant is the precision of the test. Thursday's intraday low printed at 1.40778 — essentially a one-pip kiss of that dynamic support — before modest buying interest stabilized the pair around 1.40823. In technical analysis, such clean tests of moving averages often determine whether a trend reasserts itself or begins to unravel. Holding here keeps the short-term bias tilted toward dollar bulls; a confirmed break below would redirect focus to the rising 100-hour moving average near 1.40541.
Zooming out, the broader structure still favors dollar strength. This week's low of 1.4003 respected both the psychologically weighty 1.4000 handle and the 38.2% Fibonacci retracement of the rally from early May lows to late-June highs near 1.42473. That Fibonacci level holding as support implies the larger uptrend remains structurally sound. For bears to build a credible case, they would need to consecutively break both moving averages and then breach that retracement level — a sequence that has not yet materialized.
In short, USD/CAD sits at a technical crossroads largely of its own making: a tariff-driven pop that stalled at resistance, a textbook pullback to support, and a pair that has yet to resolve which side controls the near-term narrative. Continue reading at Forexlive.